
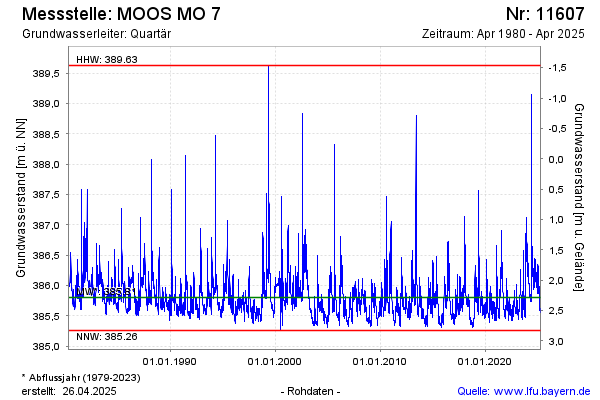
Chart of total period MOOS MO 7
Groundwater level [m above sealevel]: 385.62
Distance to surface [m]: 2.47
Last value from 24.06.2026 09:00
Ground level [m above sealevel]: 388.09
| Date | Groundwater level [m above sealevel] |
|---|---|
| 29.06.2026 | 385.58 |
| 28.06.2026 | 385.58 |
| 27.06.2026 | 385.59 |
| 26.06.2026 | 385.60 |
| 25.06.2026 | 385.61 |
| 24.06.2026 | 385.62 |
| 23.06.2026 | 385.62 |
| 22.06.2026 | 385.63 |