
- Start >
- Groundwater >
- Waterlevel of upper layer >
- Bayern >
- Limbach Q1 >
- Chart of total period

Chart of total period Limbach Q1
Groundwater levels of the total period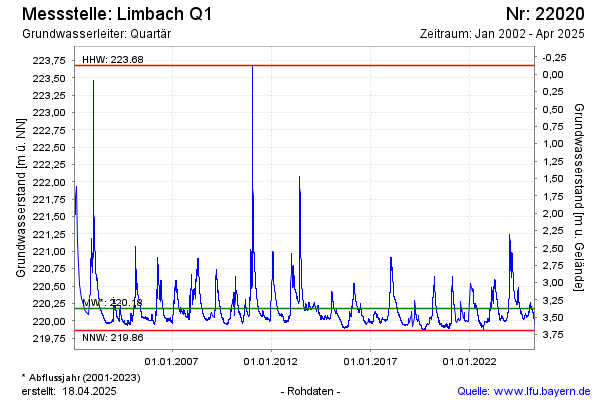
Groundwater level [m above sealevel]: 220.49
Distance to surface [m]: 3.03
Last value from 06.03.2026 10:00
Ground level [m above sealevel]: 223.52
| Date | Groundwater level [m above sealevel] |
|---|---|
| 06.03.2026 | 220.51 |
| 05.03.2026 | 220.51 |
| 04.03.2026 | 220.53 |
| 03.03.2026 | 220.55 |
| 02.03.2026 | 220.56 |
| 01.03.2026 | 220.56 |
| 28.02.2026 | 220.55 |
| 27.02.2026 | 220.51 |
© Bayerisches Landesamt für Umwelt 2026