
- Start >
- Groundwater >
- Waterlevel of upper layer >
- Bayern >
- KRAIBG.-NIEDERNDORF 13 >
- Chart of total period

Chart of total period KRAIBG.-NIEDERNDORF 13
Groundwater levels of the total period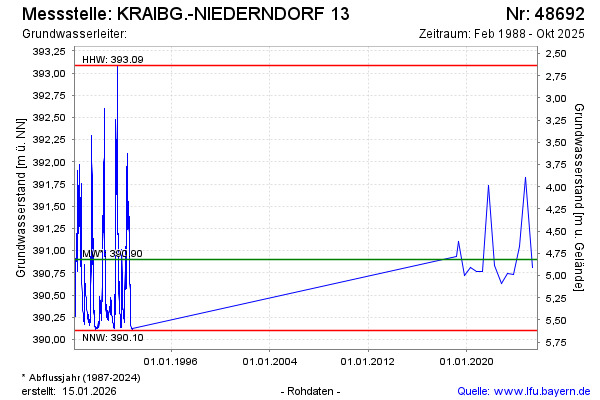
note
Die Messstelle wird nicht mehr beobachtet
Groundwater level [m above sealevel]: 391.05
Distance to surface [m]: 4.67
Last value from 16.04.2024 13:07
Ground level [m above sealevel]: 395.72
| Date | Groundwater level [m above sealevel] |
|---|---|
| 19.10.2023 | 390.73 |
| 19.04.2023 | 390.74 |
| 18.10.2022 | 390.63 |
| 13.04.2022 | 390.83 |
| 11.10.2021 | 391.74 |
| 14.04.2021 | 390.77 |
| 20.10.2020 | 390.77 |
| 21.04.2020 | 390.81 |
© Bayerisches Landesamt für Umwelt 2024