
- Start >
- Groundwater >
- Waterlevel of upper layer >
- Bayern >
- KIRCHDORF_OP10 >
- Chart of total period

Chart of total period KIRCHDORF_OP10
Groundwater levels of the total period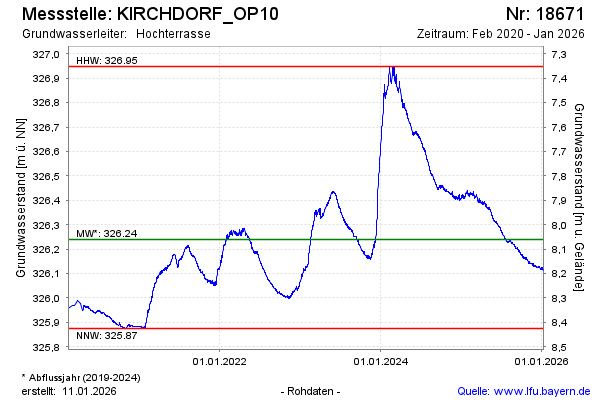
Groundwater level [m above sealevel]: 326.08
Distance to surface [m]: 8.22
Last value from 29.05.2026 08:00
Ground level [m above sealevel]: 334.30
| Date | Groundwater level [m above sealevel] |
|---|---|
| 29.05.2026 | 326.08 |
| 28.05.2026 | 326.08 |
| 27.05.2026 | 326.09 |
| 26.05.2026 | 326.09 |
| 25.05.2026 | 326.09 |
| 24.05.2026 | 326.09 |
| 23.05.2026 | 326.09 |
| 22.05.2026 | 326.09 |
© Bayerisches Landesamt für Umwelt 2026