
- Start >
- Groundwater >
- Waterlevel of upper layer >
- Bayern >
- GRASHEIM Q 3 >
- Chart of total period

Chart of total period GRASHEIM Q 3
Groundwater levels of the total period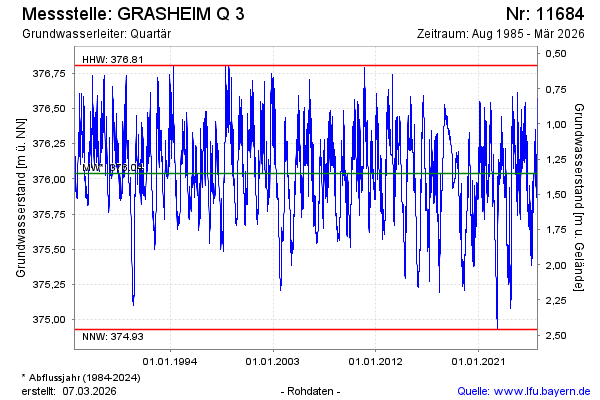
Groundwater level [m above sealevel]: 375.91
Distance to surface [m]: 1.48
Last value from 12.04.2026 09:00
Ground level [m above sealevel]: 377.39
| Date | Groundwater level [m above sealevel] |
|---|---|
| 12.04.2026 | 375.91 |
| 11.04.2026 | 375.93 |
| 10.04.2026 | 375.89 |
| 09.04.2026 | 375.87 |
| 08.04.2026 | 375.88 |
| 07.04.2026 | 375.90 |
| 06.04.2026 | 375.92 |
| 05.04.2026 | 375.94 |
© Bayerisches Landesamt für Umwelt 2026