
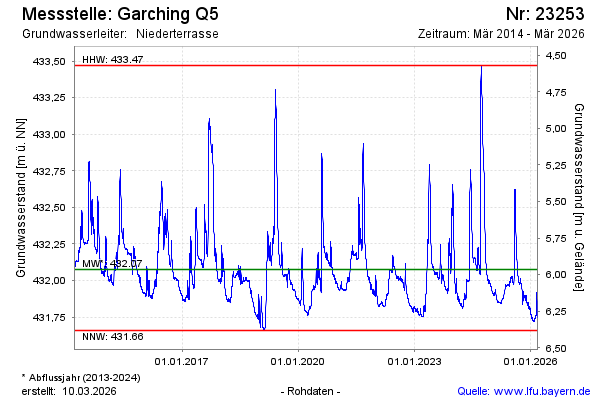
Chart of total period Garching Q5
Groundwater level [m above sealevel]: 431.91
Distance to surface [m]: 6.13
Last value from 14.07.2026 09:00
Ground level [m above sealevel]: 438.04
| Date | Groundwater level [m above sealevel] |
|---|---|
| 14.07.2026 | 431.91 |
| 13.07.2026 | 431.91 |
| 12.07.2026 | 431.91 |
| 11.07.2026 | 431.91 |
| 10.07.2026 | 431.92 |
| 09.07.2026 | 431.92 |
| 08.07.2026 | 431.92 |
| 07.07.2026 | 431.93 |