
Chart of total period GABLINGEN 11
Groundwater level [m above sealevel]: 442.78
Distance to surface [m]: 2.06
Last value from 09.10.1971 12:00
Ground level [m above sealevel]: 444.84
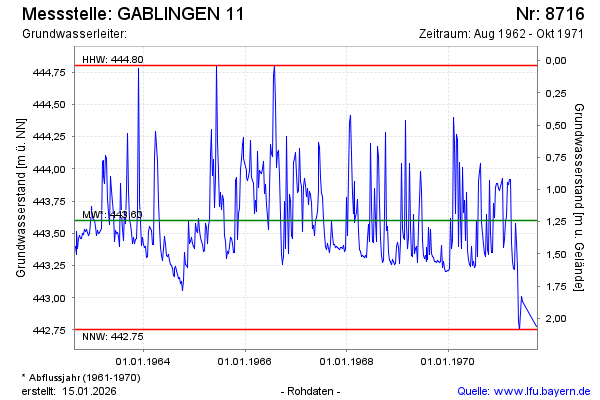
| Date | Groundwater level [m above sealevel] |
|---|---|
| 02.10.1971 | 442.78 |
| 19.06.1971 | 442.97 |
| 12.06.1971 | 443.01 |
| 29.05.1971 | 442.75 |
| 22.05.1971 | 442.82 |
| 15.05.1971 | 443.24 |
| 08.05.1971 | 443.43 |
| 30.04.1971 | 443.58 |