
- Start >
- Groundwater >
- Waterlevel of upper layer >
- Bayern >
- FISCHERDORF B 74 >
- Chart of total period

Chart of total period FISCHERDORF B 74
Groundwater levels of the total period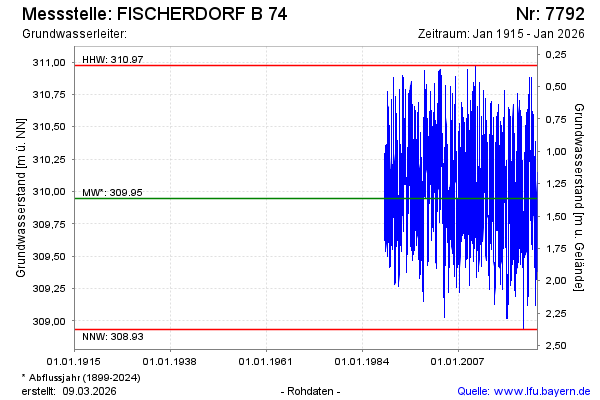
note
GW Messstelle im SN SKS Pielweichs
Groundwater level [m above sealevel]: 309.41
Distance to surface [m]: 1.90
Last value from 22.01.2026 10:10
Ground level [m above sealevel]: 311.31
| Date | Groundwater level [m above sealevel] |
|---|---|
| 22.01.2026 | 309.42 |
| 21.01.2026 | 309.44 |
| 20.01.2026 | 309.46 |
| 19.01.2026 | 309.49 |
| 18.01.2026 | 309.51 |
| 17.01.2026 | 309.51 |
| 16.01.2026 | 309.51 |
| 15.01.2026 | 309.49 |
© Bayerisches Landesamt für Umwelt 2026