
- Start >
- Groundwater >
- Waterlevel of upper layer >
- Bayern >
- Eckersmühlen Q 9 >
- Chart of total period

Chart of total period Eckersmühlen Q 9
Groundwater levels of the total period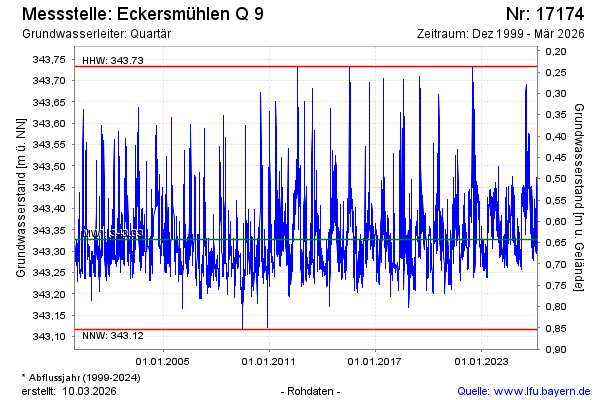
Groundwater level [m above sealevel]: 343.39
Distance to surface [m]: 0.58
Last value from 12.04.2026 10:00
Ground level [m above sealevel]: 343.97
| Date | Groundwater level [m above sealevel] |
|---|---|
| 12.04.2026 | 343.39 |
| 11.04.2026 | 343.38 |
| 10.04.2026 | 343.31 |
| 09.04.2026 | 343.27 |
| 08.04.2026 | 343.27 |
| 07.04.2026 | 343.27 |
| 06.04.2026 | 343.27 |
| 05.04.2026 | 343.27 |
© Bayerisches Landesamt für Umwelt 2026