
- Start >
- Groundwater >
- Waterlevel of upper layer >
- Bayern >
- Burghaslach Q1 >
- Chart of total period

Chart of total period Burghaslach Q1
Groundwater levels of the total period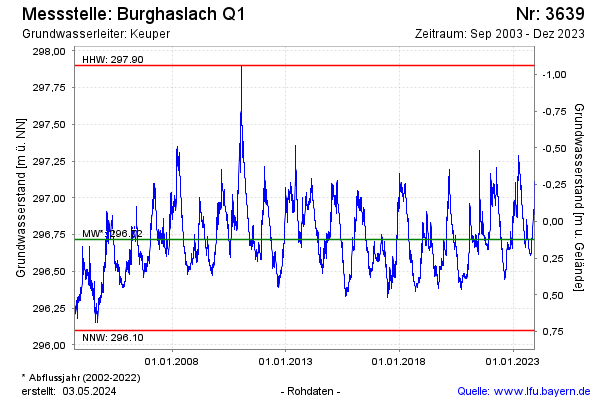
Groundwater level [m above sealevel]: 296.78
Distance to surface [m]: 0.06
Last value from 13.11.2025 11:00
Ground level [m above sealevel]: 296.84
| Date | Groundwater level [m above sealevel] |
|---|---|
| 13.11.2025 | 296.77 |
| 12.11.2025 | 296.78 |
| 11.11.2025 | 296.78 |
| 10.11.2025 | 296.78 |
| 09.11.2025 | 296.79 |
| 08.11.2025 | 296.80 |
| 07.11.2025 | 296.80 |
| 06.11.2025 | 296.81 |
© Bayerisches Landesamt für Umwelt 2026