
- Start >
- Groundwater >
- Waterlevel of upper layer >
- Bayern >
- Bruck >
- Chart of total period

Chart of total period Bruck
Groundwater levels of the total period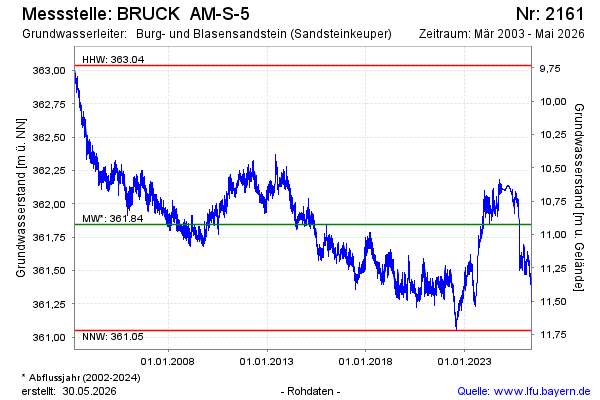
Groundwater level [m above sealevel]: 361.39
Distance to surface [m]: 11.38
Last value from 09.05.2026 04:00
Ground level [m above sealevel]: 372.77
| Date | Groundwater level [m above sealevel] |
|---|---|
| 08.05.2026 | 361.41 |
| 07.05.2026 | 361.42 |
| 06.05.2026 | 361.46 |
| 05.05.2026 | 361.47 |
| 04.05.2026 | 361.48 |
| 03.05.2026 | 361.47 |
| 02.05.2026 | 361.43 |
| 01.05.2026 | 361.40 |
© Bayerisches Landesamt für Umwelt 2026