
- Start >
- Groundwater >
- Waterlevel of upper layer >
- Bayern >
- BOBINGEN 600 >
- Chart of total period

Chart of total period BOBINGEN 600
Groundwater levels of the total period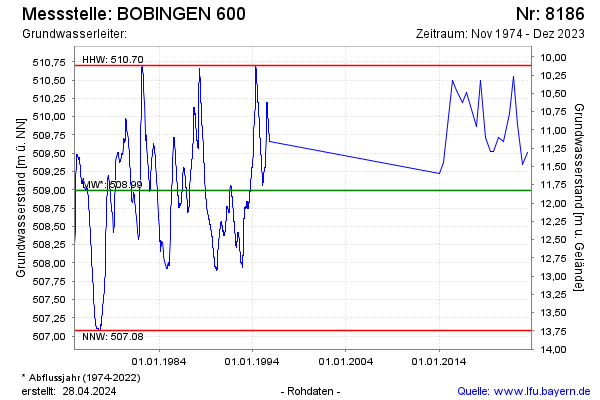
Groundwater level [m above sealevel]: 509.90
Distance to surface [m]: 10.92
Last value from 15.12.2025 10:00
Ground level [m above sealevel]: 520.82
| Date | Groundwater level [m above sealevel] |
|---|---|
| 04.12.2024 | 511.60 |
| 01.07.2024 | 509.74 |
| 14.12.2023 | 510.06 |
| 15.06.2023 | 509.51 |
| 01.12.2022 | 509.35 |
| 15.06.2022 | 509.90 |
| 09.12.2021 | 510.55 |
| 21.07.2021 | 510.04 |
© Bayerisches Landesamt für Umwelt 2026