
- Start >
- Groundwater >
- Waterlevel of upper layer >
- Bayern >
- BAD GÖGGING G3 >
- Chart of total period

Chart of total period BAD GÖGGING G3
Groundwater levels of the total period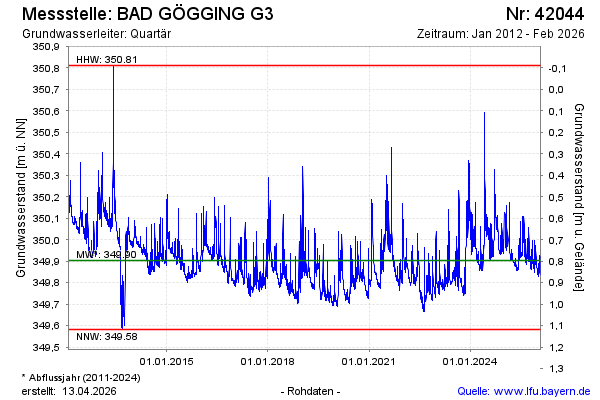
Groundwater level [m above sealevel]: 349.81
Distance to surface [m]: 0.89
Last value from 05.05.2026 09:35
Ground level [m above sealevel]: 350.70
| Date | Groundwater level [m above sealevel] |
|---|---|
| 05.05.2026 | 349.81 |
| 04.05.2026 | 349.81 |
| 03.05.2026 | 349.81 |
| 02.05.2026 | 349.81 |
| 01.05.2026 | 349.81 |
| 30.04.2026 | 349.81 |
| 29.04.2026 | 349.82 |
| 28.04.2026 | 349.82 |
© Bayerisches Landesamt für Umwelt 2026