
- Start >
- Groundwater >
- Flow of springs >
- Regnitz >
- Bischofsried >
- Chart of total period

Chart of total period Bischofsried
Flow of wells of the total period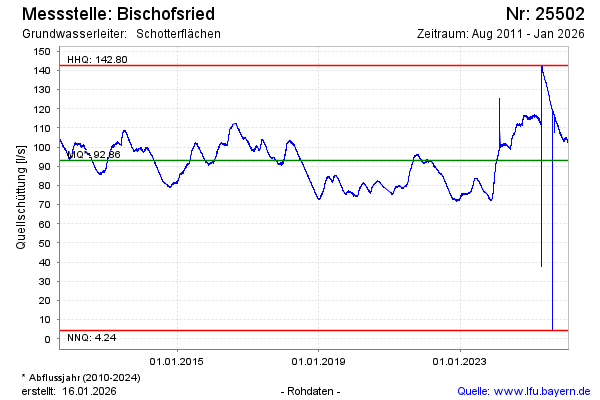
Flow [l/s]: 100,96
Last value from 05.06.2024 02:45
Ground level [m above sealevel]: --
| Date | Flow of well [l/s] |
|---|---|
| 04.06.2024 | 100.81 |
| 03.06.2024 | 100.40 |
| 02.06.2024 | 100.10 |
| 01.06.2024 | 99.83 |
| 31.05.2024 | 98.94 |
| 30.05.2024 | 99.27 |
| 29.05.2024 | 99.15 |
| 28.05.2024 | 98.85 |
© Bayerisches Landesamt für Umwelt 2024