
- Start >
- Groundwater >
- Flow of springs >
- Bayern >
- Mühlbachquelle 1-3 >
- Chart of total period

Chart of total period Mühlbachquelle 1-3
Flow of wells of the total period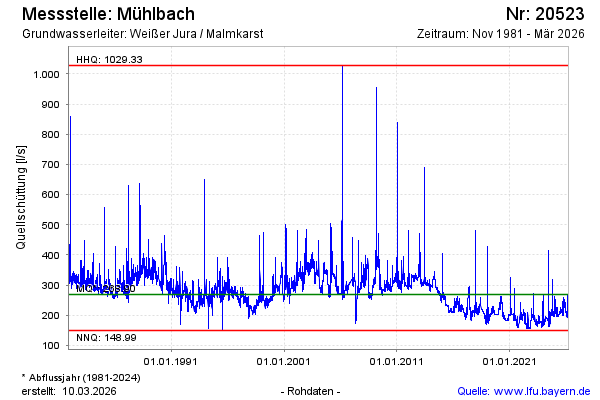
Flow [l/s]: 208,97
Last value from 06.12.2025 07:30
Ground level [m above sealevel]: 365.73
| Date | Flow of well [l/s] |
|---|---|
| 05.12.2025 | 208.97 |
| 04.12.2025 | 208.97 |
| 03.12.2025 | 208.97 |
| 02.12.2025 | 209.40 |
| 01.12.2025 | 210.25 |
| 30.11.2025 | 215.60 |
| 29.11.2025 | 220.85 |
| 28.11.2025 | 224.91 |
© Bayerisches Landesamt für Umwelt 2025