
- Start >
- Groundwater >
- Flow of springs >
- Bayern >
- Gori-Quelle >
- Chart of total period

Chart of total period Gori-Quelle
Flow of wells of the total period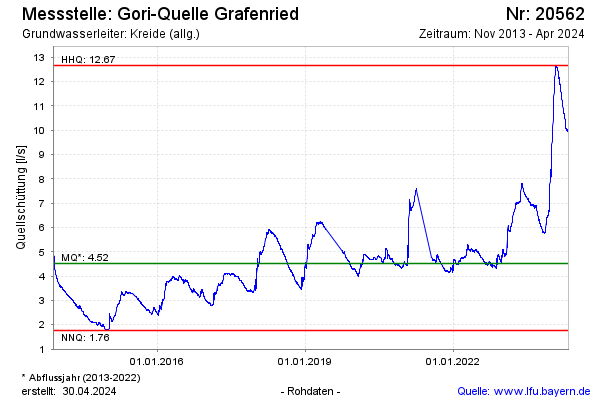
Flow [l/s]: 9,70
Last value from 09.05.2024 10:00
Ground level [m above sealevel]: --
| Date | Flow of well [l/s] |
|---|---|
| 09.05.2024 | 9.67 |
| 08.05.2024 | 9.71 |
| 07.05.2024 | 9.74 |
| 06.05.2024 | 9.80 |
| 05.05.2024 | 9.84 |
| 04.05.2024 | 9.89 |
| 03.05.2024 | 9.89 |
| 02.05.2024 | 9.96 |
© Bayerisches Landesamt für Umwelt 2024