
- Start >
- Groundwater >
- Flow of springs >
- Bayern >
- Bergmannsquellen 9/16 >
- Chart of total period

Chart of total period Bergmannsquellen 9/16
Flow of wells of the total period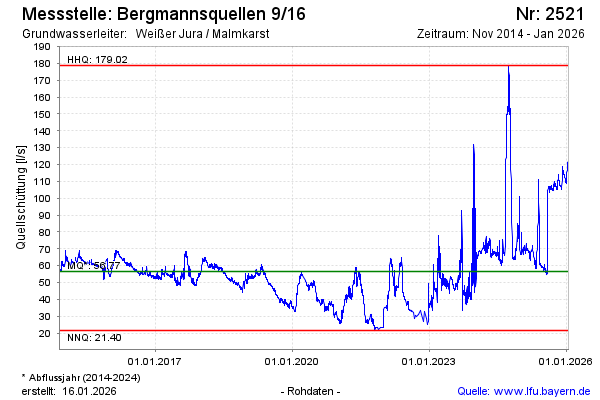
note
Ab einem Wasserstand von ca. 190 cm am Pegel Michelfeld wird die Schttungsmessung an der Quelle durch Rckstau der Pegnitz beeinflusst.
Flow [l/s]: 115,13
Last value from 08.12.2025 09:00
Ground level [m above sealevel]: --
| Date | Flow of well [l/s] |
|---|---|
| 08.12.2025 | 115.44 |
| 07.12.2025 | 115.31 |
| 06.12.2025 | 115.04 |
| 05.12.2025 | 114.96 |
| 04.12.2025 | 116.08 |
| 03.12.2025 | 116.69 |
| 02.12.2025 | 116.98 |
| 01.12.2025 | 117.20 |
© Bayerisches Landesamt für Umwelt 2025