
- Start >
- Groundwater >
- Waterlevel of deep layer >
- Untere Donau >
- WISSELSDORF T9 >
- Chart of total period

Chart of total period WISSELSDORF T9
Groundwater levels of the total period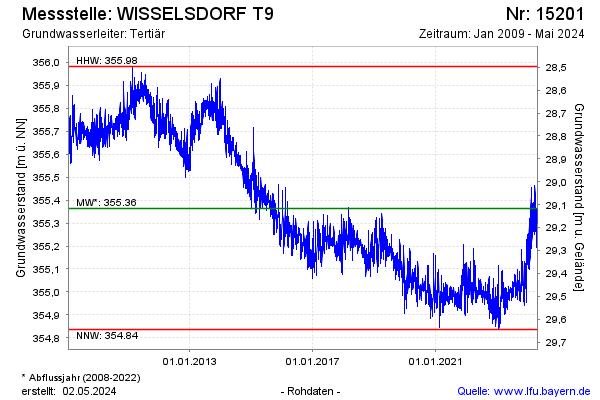
Groundwater level [m above sealevel]: 355.21
Distance to surface [m]: 29.27
Last value from 21.05.2026 10:00
Ground level [m above sealevel]: 384.48
| Date | Groundwater level [m above sealevel] |
|---|---|
| 21.05.2026 | 355.22 |
| 20.05.2026 | 355.24 |
| 19.05.2026 | 355.27 |
| 18.05.2026 | 355.30 |
| 17.05.2026 | 355.30 |
| 16.05.2026 | 355.36 |
| 15.05.2026 | 355.40 |
| 14.05.2026 | 355.39 |
© Bayerisches Landesamt für Umwelt 2026