
- Start >
- Groundwater >
- Waterlevel of deep layer >
- Unterer Main >
- Massbach VB L >
- Chart of total period

Chart of total period Massbach VB L
Groundwater levels of the total period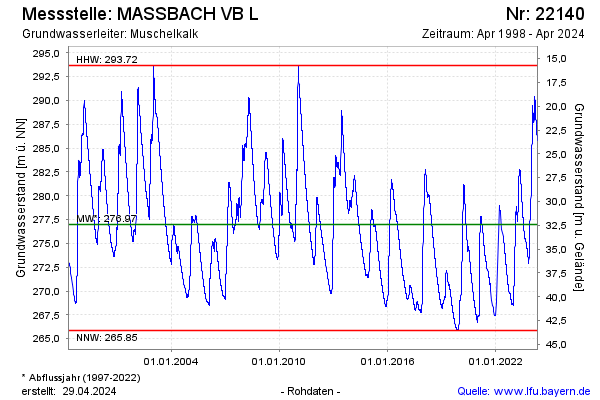
Groundwater level [m above sealevel]: 272.77
Distance to surface [m]: 36.62
Last value from 09.05.2026 10:00
Ground level [m above sealevel]: 309.39
| Date | Groundwater level [m above sealevel] |
|---|---|
| 09.05.2026 | 272.82 |
| 08.05.2026 | 272.85 |
| 07.05.2026 | 272.90 |
| 06.05.2026 | 272.96 |
| 05.05.2026 | 273.01 |
| 04.05.2026 | 273.06 |
| 03.05.2026 | 273.11 |
| 02.05.2026 | 273.16 |
© Bayerisches Landesamt für Umwelt 2026