
- Start >
- Groundwater >
- Waterlevel of deep layer >
- Unterer Main >
- Massbach MST 1 >
- Chart of total period

Chart of total period Massbach MST 1
Groundwater levels of the total period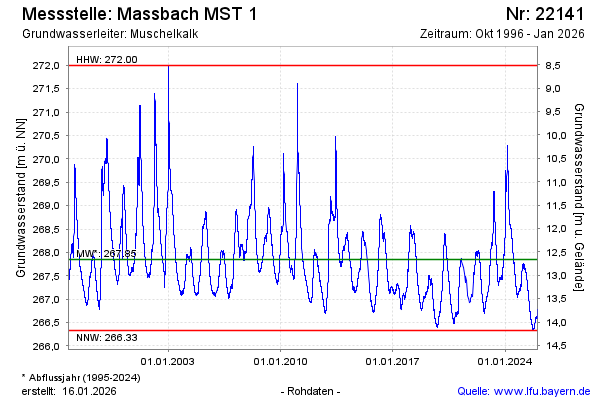
Groundwater level [m above sealevel]: 267.14
Distance to surface [m]: 13.37
Last value from 20.05.2026 10:00
Ground level [m above sealevel]: 280.51
| Date | Groundwater level [m above sealevel] |
|---|---|
| 20.05.2026 | 267.16 |
| 19.05.2026 | 267.16 |
| 18.05.2026 | 267.18 |
| 17.05.2026 | 267.19 |
| 16.05.2026 | 267.21 |
| 15.05.2026 | 267.23 |
| 14.05.2026 | 267.24 |
| 13.05.2026 | 267.23 |
© Bayerisches Landesamt für Umwelt 2026