
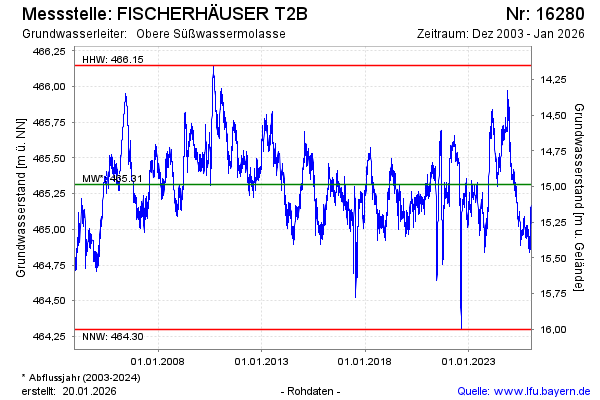
Chart of total period FISCHERHÄUSER T2B
Groundwater level [m above sealevel]: 464.70
Distance to surface [m]: 15.6
Last value from 14.07.2026 10:00
Ground level [m above sealevel]: 480.30
| Date | Groundwater level [m above sealevel] |
|---|---|
| 14.07.2026 | 464.71 |
| 13.07.2026 | 464.69 |
| 12.07.2026 | 464.70 |
| 11.07.2026 | 464.72 |
| 10.07.2026 | 464.72 |
| 09.07.2026 | 464.72 |
| 08.07.2026 | 464.73 |
| 07.07.2026 | 464.74 |