
- Start >
- Groundwater >
- Waterlevel of deep layer >
- Bayern >
- Schuetzing T1 >
- Chart of total period

Chart of total period Schuetzing T1
Groundwater levels of the total period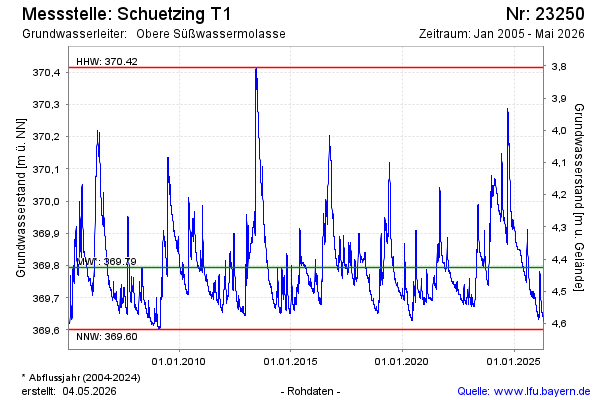
Groundwater level [m above sealevel]: 369.61
Distance to surface [m]: 4.61
Last value from 20.05.2026 09:00
Ground level [m above sealevel]: 374.22
| Date | Groundwater level [m above sealevel] |
|---|---|
| 20.05.2026 | 369.62 |
| 19.05.2026 | 369.62 |
| 18.05.2026 | 369.62 |
| 17.05.2026 | 369.62 |
| 16.05.2026 | 369.62 |
| 15.05.2026 | 369.62 |
| 14.05.2026 | 369.62 |
| 13.05.2026 | 369.62 |
© Bayerisches Landesamt für Umwelt 2026