
- Start >
- Groundwater >
- Waterlevel of deep layer >
- Bayern >
- ROTTBACH T 11 >
- Chart of total period

Chart of total period ROTTBACH T 11
Groundwater levels of the total period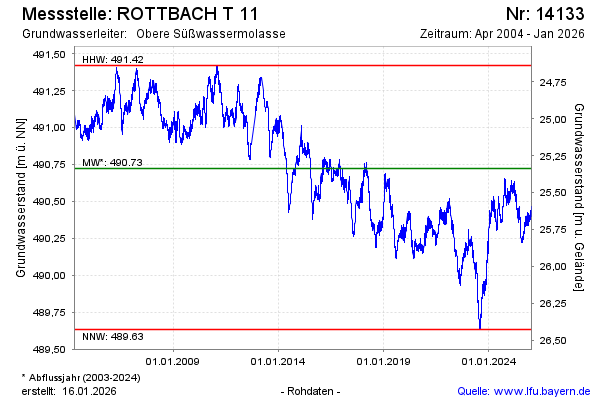
note
Aufgrund eines Fehlers an der Messsonde können im Moment falsche Werte aufgezeichnet werden. Wir werden schnellstmöglich eine Reparatur veranlassen.
Groundwater level [m above sealevel]: 490.12
Distance to surface [m]: 25.94
Last value from 29.05.2026 09:00
Ground level [m above sealevel]: 516.06
| Date | Groundwater level [m above sealevel] |
|---|---|
| 29.05.2026 | 490.13 |
| 28.05.2026 | 490.14 |
| 27.05.2026 | 490.15 |
| 26.05.2026 | 490.14 |
| 25.05.2026 | 490.14 |
| 24.05.2026 | 490.15 |
| 23.05.2026 | 490.15 |
| 22.05.2026 | 490.16 |
© Bayerisches Landesamt für Umwelt 2026