
- Start >
- Groundwater >
- Waterlevel of deep layer >
- Bayern >
- Hochmutting T 1f >
- Chart of total period

Chart of total period Hochmutting T 1f
Groundwater levels of the total period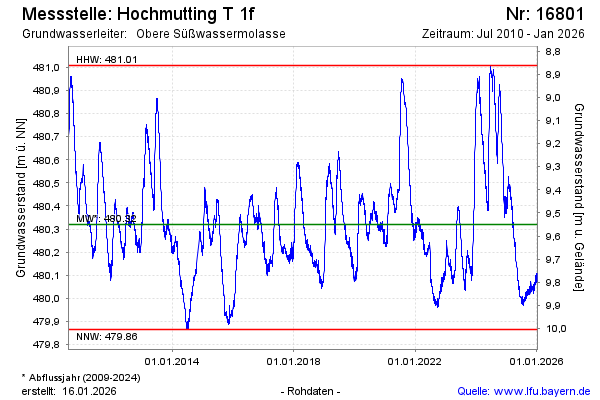
Groundwater level [m above sealevel]: 480.23
Distance to surface [m]: 9.64
Last value from 12.04.2026 10:00
Ground level [m above sealevel]: 489.87
| Date | Groundwater level [m above sealevel] |
|---|---|
| 12.04.2026 | 480.23 |
| 11.04.2026 | 480.24 |
| 10.04.2026 | 480.24 |
| 09.04.2026 | 480.24 |
| 08.04.2026 | 480.23 |
| 07.04.2026 | 480.24 |
| 06.04.2026 | 480.24 |
| 05.04.2026 | 480.25 |
© Bayerisches Landesamt für Umwelt 2026