
- Start >
- Groundwater >
- Chemistry >
- Untere Donau >
- 4110754400007 >
- Chart of total period

Chart of total period 4110754400007
Data from 15.05.2007 to 27.05.2013
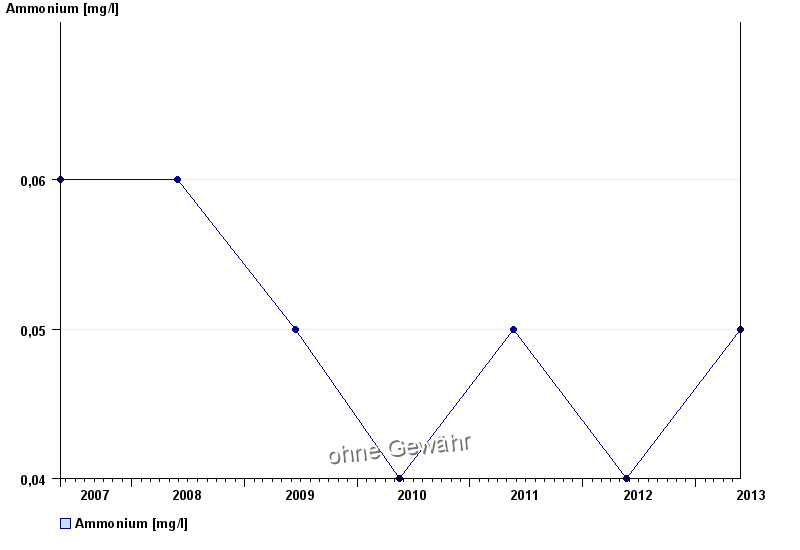
| Date | Ammonium [mg/l] |
|---|---|
| 27.05.2013 | 0.05 |
| 22.05.2012 | 0.04 |
| 23.05.2011 | 0.05 |
| 17.05.2010 | 0.04 |
| 16.06.2009 | 0.05 |
| 29.05.2008 | 0.06 |
| 15.05.2007 | 0.06 |
© Bayerisches Landesamt für Umwelt 2025