
- Start >
- Groundwater >
- Chemistry >
- Unterer Main >
- 1131602700017 >
- Chart of total period

Chart of total period 1131602700017
Data from 16.09.2014 to 13.09.2021
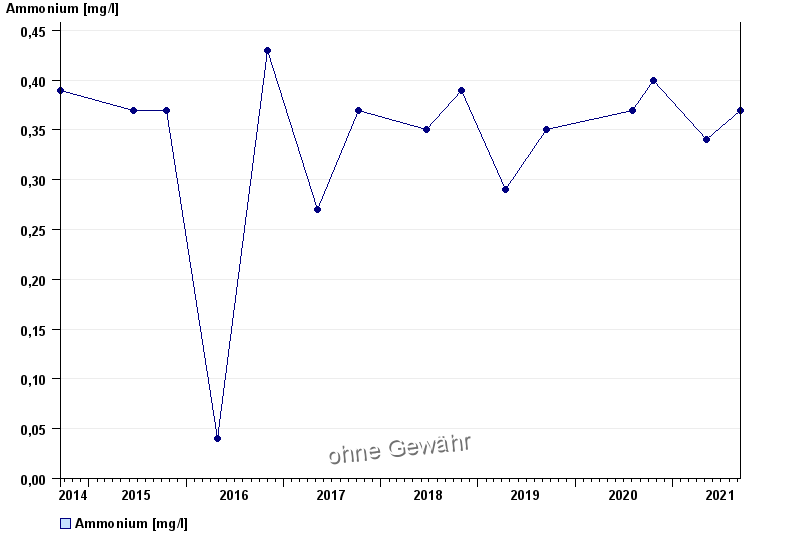
| Date | Ammonium [mg/l] |
|---|---|
| 13.09.2021 | 0.37 |
| 10.05.2021 | 0.34 |
| 20.10.2020 | 0.4 |
| 04.08.2020 | 0.37 |
| 17.09.2019 | 0.35 |
| 15.04.2019 | 0.29 |
| 31.10.2018 | 0.39 |
© Bayerisches Landesamt für Umwelt 2024