
- Start >
- Groundwater >
- Chemistry >
- Unterer Main >
- 1131582600067 >
- Chart of total period

Chart of total period 1131582600067
Data from 22.05.2007 to 03.06.2014
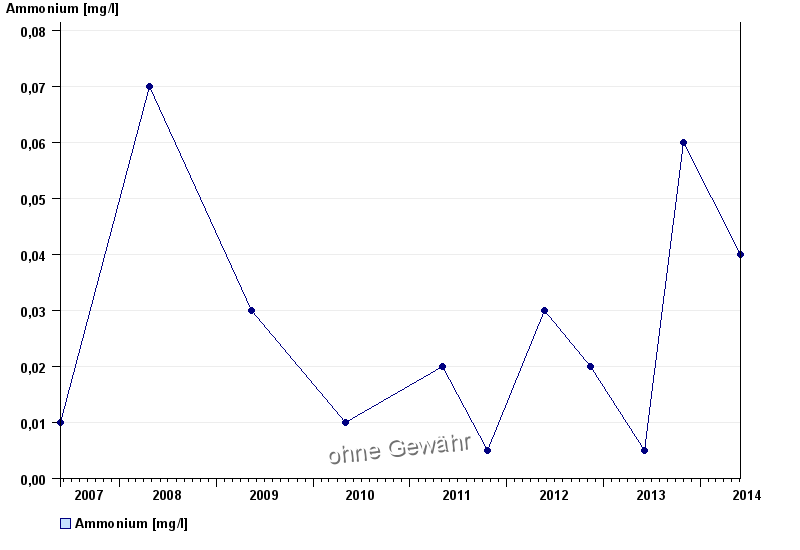
| Date | Ammonium [mg/l] |
|---|---|
| 03.06.2014 | 0.04 |
| 29.10.2013 | 0.06 |
| 04.06.2013 | < 0.005 |
| 12.11.2012 | 0.02 |
| 23.05.2012 | 0.03 |
| 20.10.2011 | N 0.005 |
| 04.05.2011 | 0.02 |
© Bayerisches Landesamt für Umwelt 2025