
- Start >
- Groundwater >
- Chemistry >
- Obere Donau >
- 1132703600039 >
- Chart of total period

Chart of total period 1132703600039
Data from 02.02.2018 to 28.07.2021
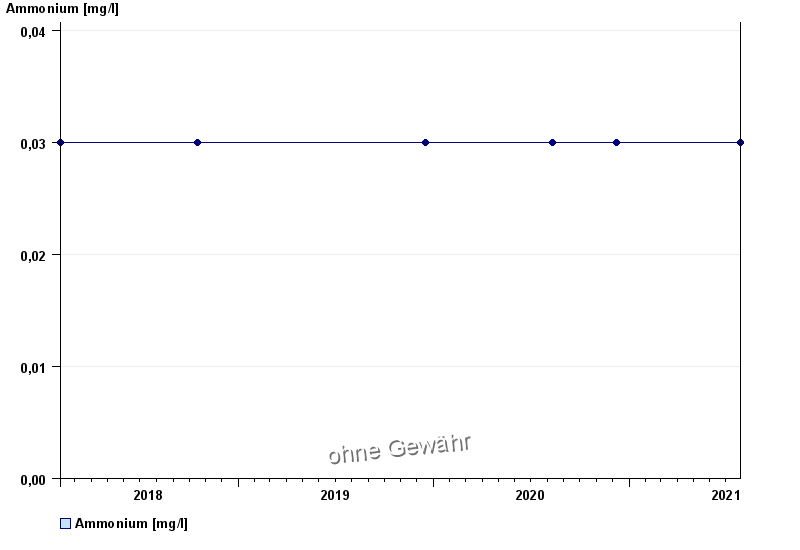
| Date | Ammonium [mg/l] |
|---|---|
| 28.07.2021 | < 0.03 |
| 08.12.2020 | < 0.03 |
| 11.08.2020 | < 0.03 |
| 17.12.2019 | < 0.03 |
| 17.10.2018 | < 0.03 |
| 02.02.2018 | < 0.03 |
© Bayerisches Landesamt für Umwelt 2024