
- Start >
- Groundwater >
- Chemistry >
- Obere Donau >
- 1131733800169 >
- Chart of total period

Chart of total period 1131733800169
Data from 16.04.2018 to 19.10.2021
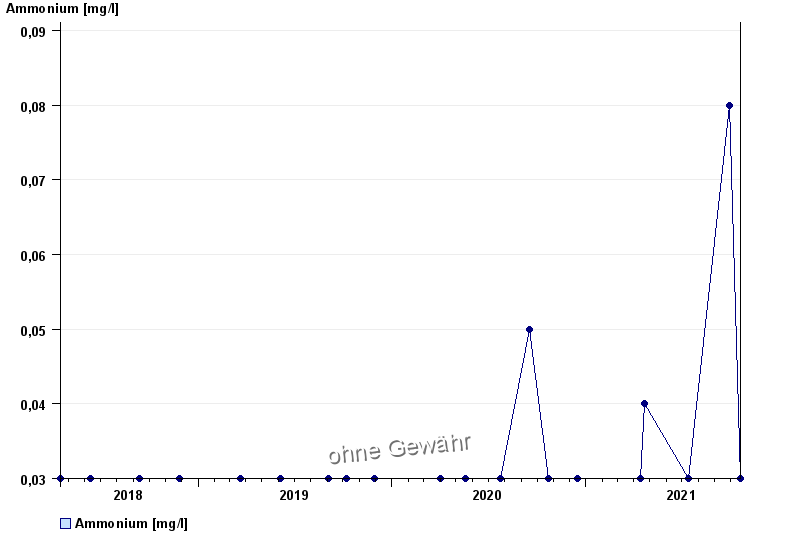
| Date | Ammonium [mg/l] |
|---|---|
| 19.10.2021 | < 0.03 |
| 29.09.2021 | 0.08 |
| 13.07.2021 | < 0.03 |
| 21.04.2021 | 0.04 |
| 13.04.2021 | 0.03 |
| 15.12.2020 | < 0.03 |
| 22.10.2020 | < 0.03 |
© Bayerisches Landesamt für Umwelt 2024