
- Start >
- Groundwater >
- Chemistry >
- Isar >
- 4110783900022 >
- Chart of total period

Chart of total period 4110783900022
Data from 27.06.2007 to 04.06.2014
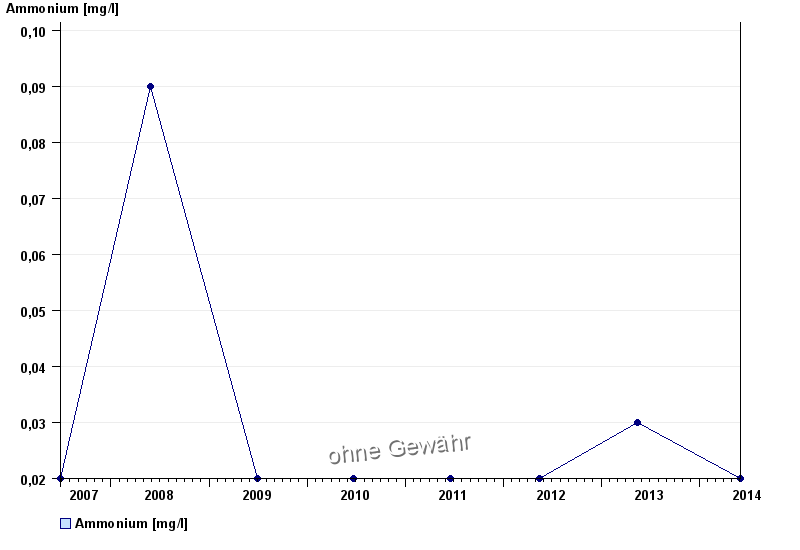
| Date | Ammonium [mg/l] |
|---|---|
| 04.06.2014 | < 0.02 |
| 15.05.2013 | 0.03 |
| 15.05.2012 | < 0.02 |
| 21.06.2011 | < 0.02 |
| 24.06.2010 | < 0.02 |
| 30.06.2009 | < 0.02 |
| 29.05.2008 | 0.09 |
© Bayerisches Landesamt für Umwelt 2025