
- Start >
- Groundwater >
- Chemistry >
- Isar >
- 1132793300247 >
- Chart of total period

Chart of total period 1132793300247
Data from 21.06.2007 to 16.05.2013
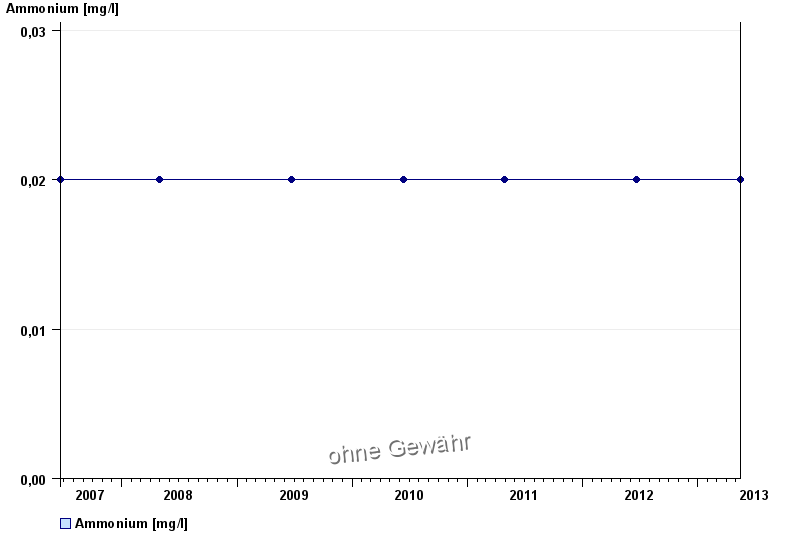
| Date | Ammonium [mg/l] |
|---|---|
| 16.05.2013 | < 0.02 |
| 19.06.2012 | < 0.02 |
| 28.04.2011 | < 0.02 |
| 14.06.2010 | < 0.02 |
| 22.06.2009 | < 0.02 |
| 29.04.2008 | 0.02 |
| 21.06.2007 | < 0.02 |
© Bayerisches Landesamt für Umwelt 2025