
- Start >
- Groundwater >
- Chemistry >
- Isar >
- 1131813700032 >
- Chart of total period

Chart of total period 1131813700032
Data from 07.05.2007 to 07.07.2021
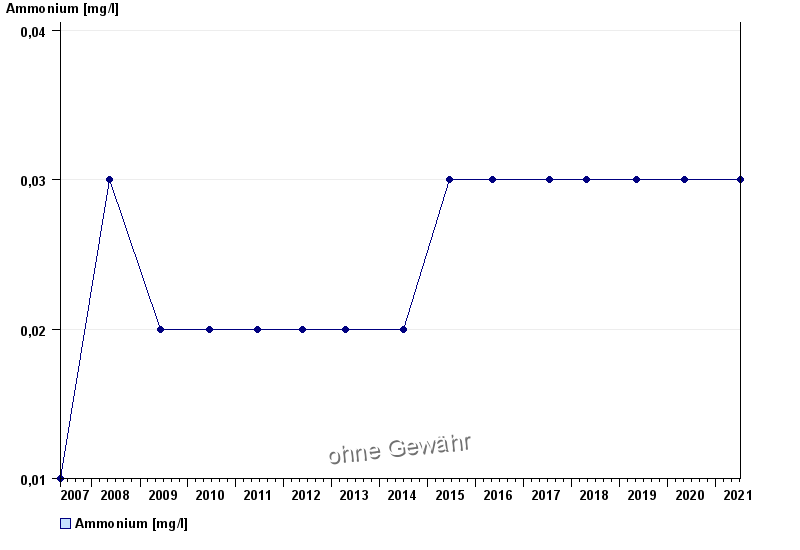
| Date | Ammonium [mg/l] |
|---|---|
| 07.07.2021 | < 0.03 |
| 06.05.2020 | < 0.03 |
| 08.05.2019 | < 0.03 |
| 24.04.2018 | < 0.03 |
| 18.07.2017 | < 0.03 |
| 10.05.2016 | < 0.03 |
| 17.06.2015 | < 0.03 |
© Bayerisches Landesamt für Umwelt 2024