
- Start >
- Groundwater >
- Chemistry >
- Oberer Main - Elbe >
- 4110583100012 >
- Chart of total period

Chart of total period 4110583100012
Data from 13.06.2007 to 09.06.2021
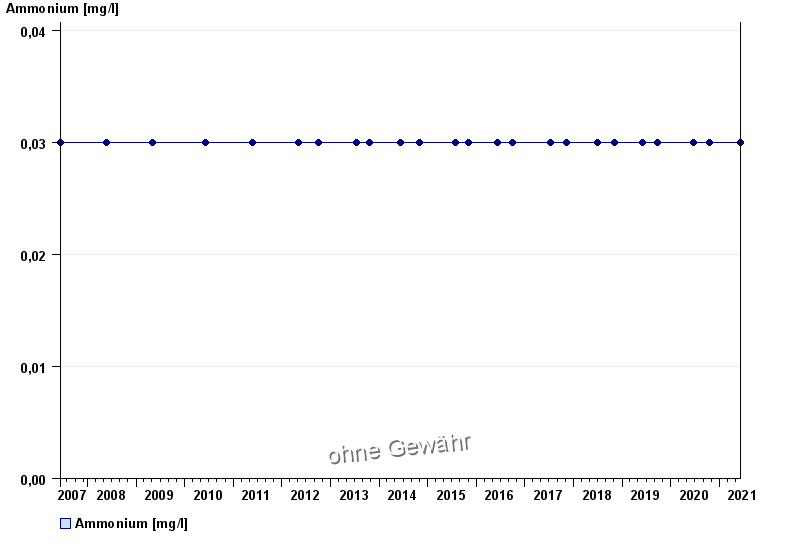
| Date | Ammonium [mg/l] |
|---|---|
| 09.06.2021 | < 0.03 |
| 21.10.2020 | < 0.03 |
| 23.06.2020 | < 0.03 |
| 25.09.2019 | < 0.03 |
| 04.06.2019 | < 0.03 |
| 07.11.2018 | < 0.03 |
| 04.07.2018 | < 0.03 |
© Bayerisches Landesamt für Umwelt 2024