
- Start >
- Groundwater >
- Chemistry >
- Bayern >
- 4120583100023 >
- Chart of total period

Chart of total period 4120583100023
Data from 26.05.2010 to 05.06.2013
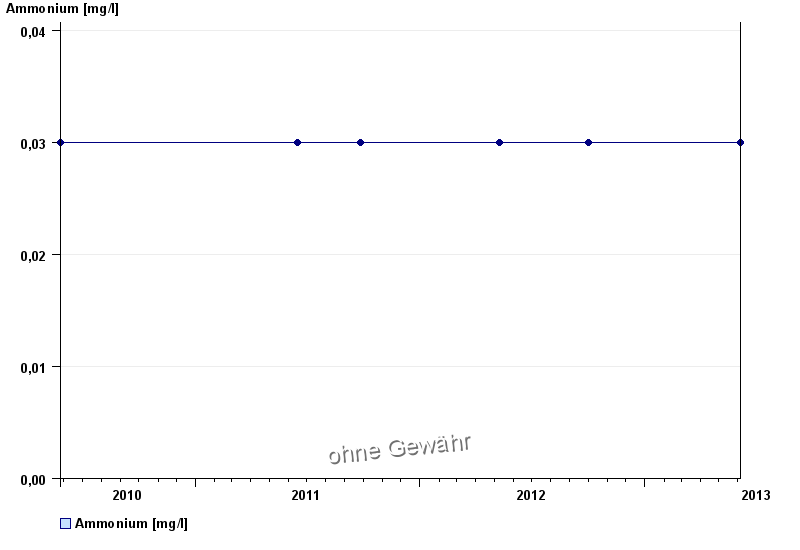
| Date | Ammonium [mg/l] |
|---|---|
| 05.06.2013 | 0.03 |
| 01.10.2012 | < 0.03 |
| 08.05.2012 | < 0.03 |
| 26.09.2011 | < 0.03 |
| 16.06.2011 | < 0.03 |
| 26.05.2010 | < 0.03 |
© Bayerisches Landesamt für Umwelt 2025