
- Start >
- Groundwater >
- Chemistry >
- Bayern >
- 4120563600023 >
- Chart of total period

Chart of total period 4120563600023
Data from 26.06.2007 to 04.05.2021
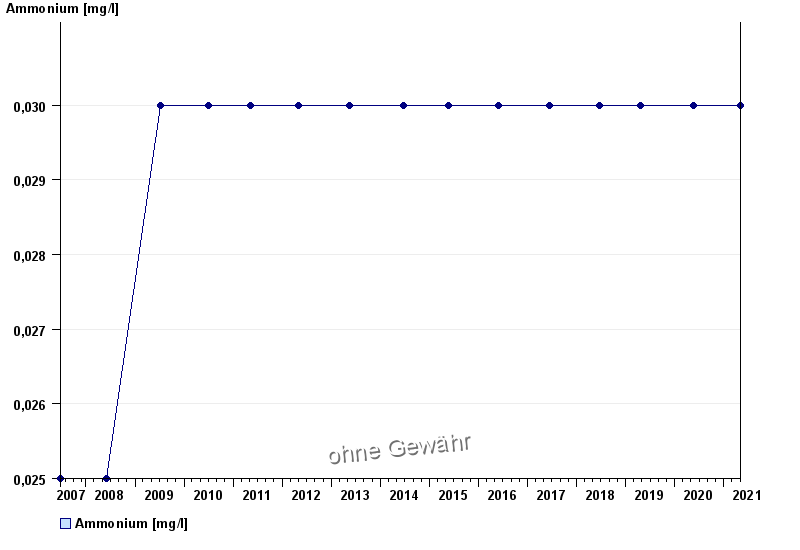
| Date | Ammonium [mg/l] |
|---|---|
| 04.05.2021 | < 0.03 |
| 18.05.2020 | < 0.03 |
| 24.04.2019 | < 0.03 |
| 20.06.2018 | < 0.03 |
| 13.06.2017 | < 0.03 |
| 31.05.2016 | < 0.03 |
| 20.05.2015 | < 0.03 |
© Bayerisches Landesamt für Umwelt 2024