
- Start >
- Groundwater >
- Chemistry >
- Bayern >
- 4110602000095 >
- Chart of total period

Chart of total period 4110602000095
Data from 09.08.2011 to 07.10.2013
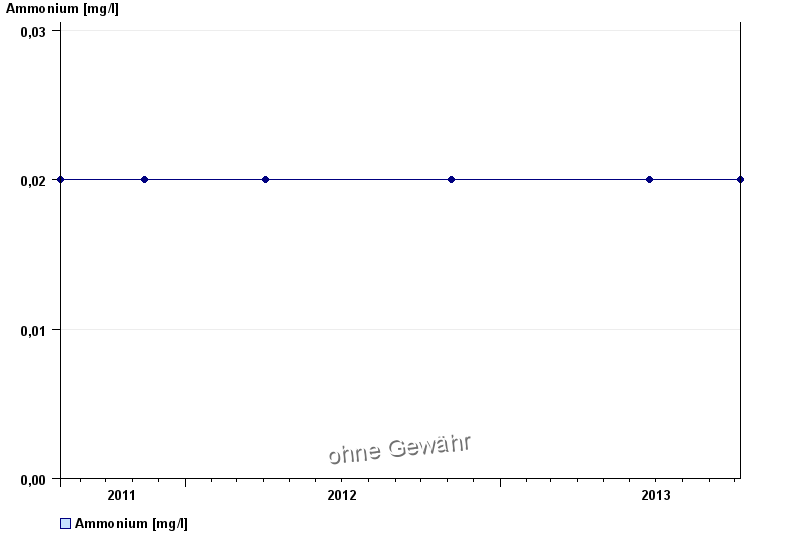
| Date | Ammonium [mg/l] |
|---|---|
| 07.10.2013 | < 0.02 |
| 24.06.2013 | < 0.02 |
| 05.11.2012 | < 0.02 |
| 03.04.2012 | < 0.02 |
| 15.11.2011 | < 0.02 |
| 09.08.2011 | < 0.02 |
© Bayerisches Landesamt für Umwelt 2025