
- Start >
- Groundwater >
- Chemistry >
- Bayern >
- 4110573600004 >
- Chart of total period

Chart of total period 4110573600004
Data from 27.05.2014 to 25.11.2024
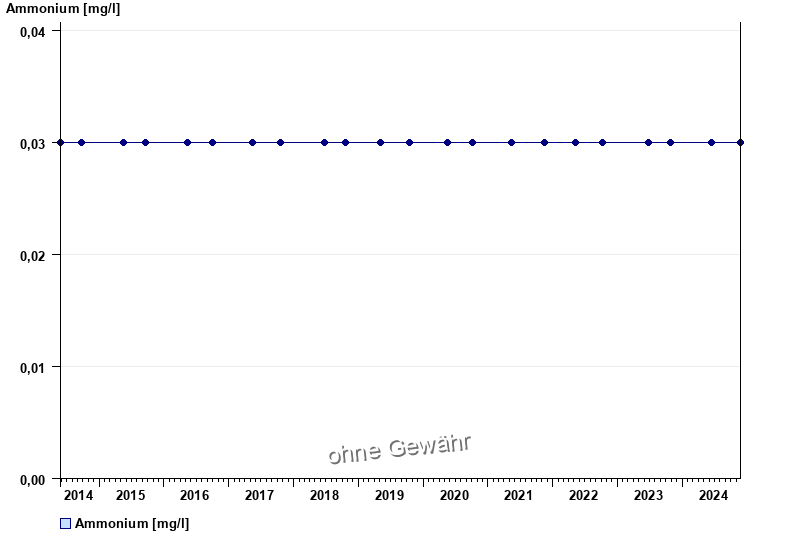
| Date | Ammonium [mg/l] |
|---|---|
| 25.11.2024 | < 0.03 |
| 17.06.2024 | < 0.03 |
| 25.10.2023 | < 0.03 |
| 27.06.2023 | < 0.03 |
| 11.10.2022 | < 0.03 |
| 10.05.2022 | < 0.03 |
| 16.11.2021 | < 0.03 |
© Bayerisches Landesamt für Umwelt 2025