
- Start >
- Groundwater >
- Chemistry >
- Bayern >
- 1131793200152 >
- Chart of total period

Chart of total period 1131793200152
Data from 26.06.2007 to 13.07.2021
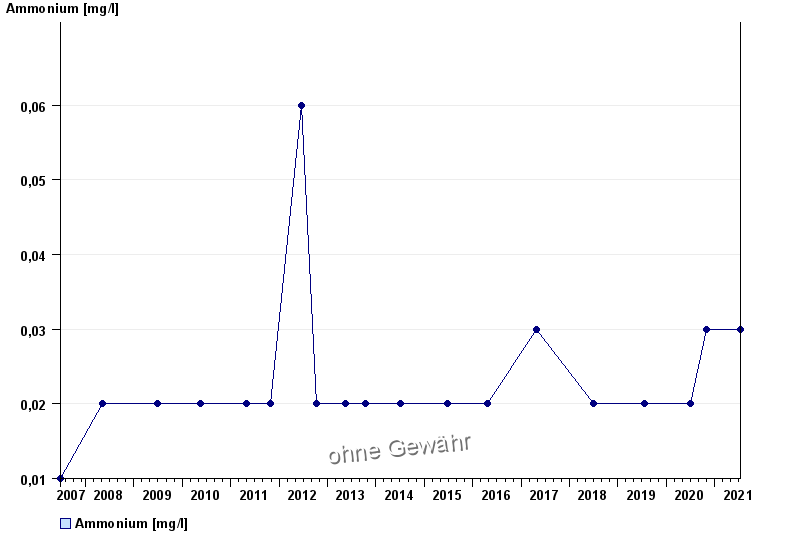
| Date | Ammonium [mg/l] |
|---|---|
| 13.07.2021 | < 0.03 |
| 02.11.2020 | < 0.03 |
| 29.06.2020 | < 0.02 |
| 23.07.2019 | < 0.02 |
| 03.07.2018 | < 0.02 |
| 26.04.2017 | 0.03 |
| 21.04.2016 | < 0.02 |
© Bayerisches Landesamt für Umwelt 2024