
- Start >
- Groundwater >
- Chemistry >
- Bayern >
- 1131743200035 >
- Chart of total period

Chart of total period 1131743200035
Data from 10.09.2018 to 26.04.2021
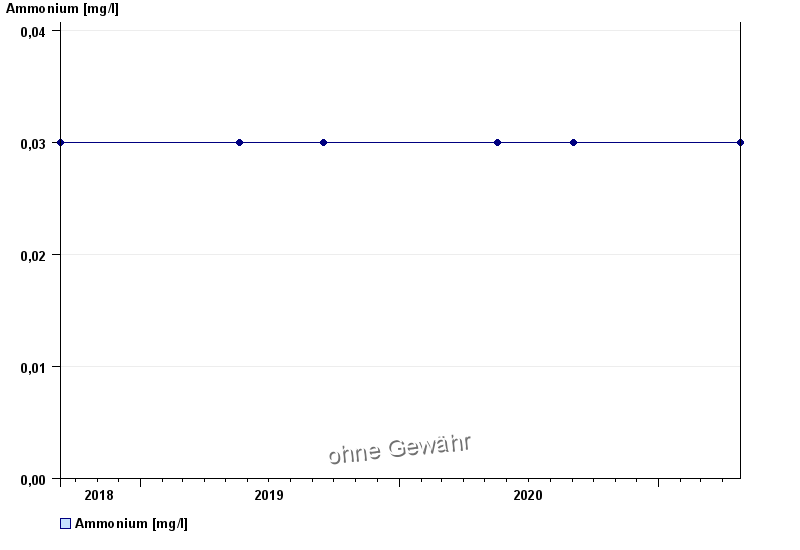
| Date | Ammonium [mg/l] |
|---|---|
| 26.04.2021 | < 0.03 |
| 02.09.2020 | < 0.03 |
| 18.05.2020 | < 0.03 |
| 16.09.2019 | < 0.03 |
| 20.05.2019 | < 0.03 |
| 10.09.2018 | < 0.03 |
© Bayerisches Landesamt für Umwelt 2024