
- Start >
- Groundwater >
- Chemistry >
- Bayern >
- 1131723800036 >
- Chart of total period

Chart of total period 1131723800036
Data from 19.05.2014 to 20.07.2021
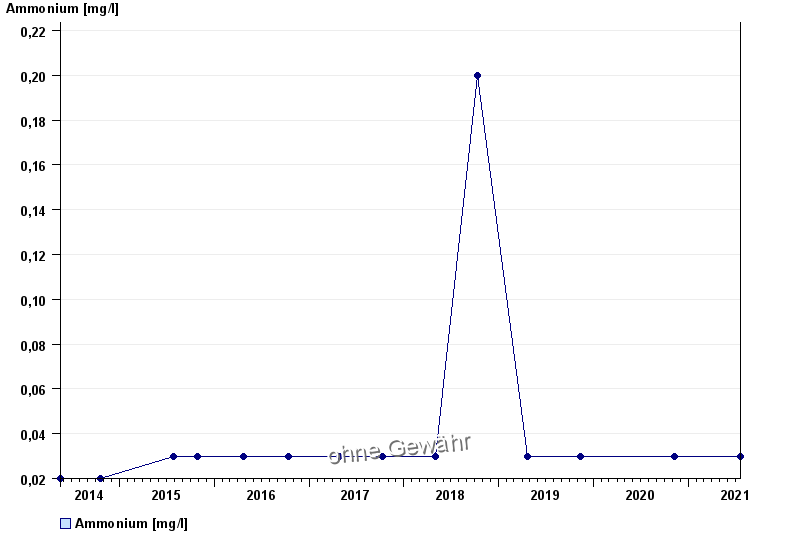
| Date | Ammonium [mg/l] |
|---|---|
| 20.07.2021 | < 0.03 |
| 09.11.2020 | < 0.03 |
| 12.11.2019 | < 0.03 |
| 23.04.2019 | < 0.03 |
| 10.10.2018 | 0.2 |
| 02.05.2018 | < 0.03 |
| 10.10.2017 | < 0.03 |
© Bayerisches Landesamt für Umwelt 2024