
- Startseite >
- Flüsse >
- Wasserstand >
- Untere Donau >
- Sägmühle >
- Jahresgrafik

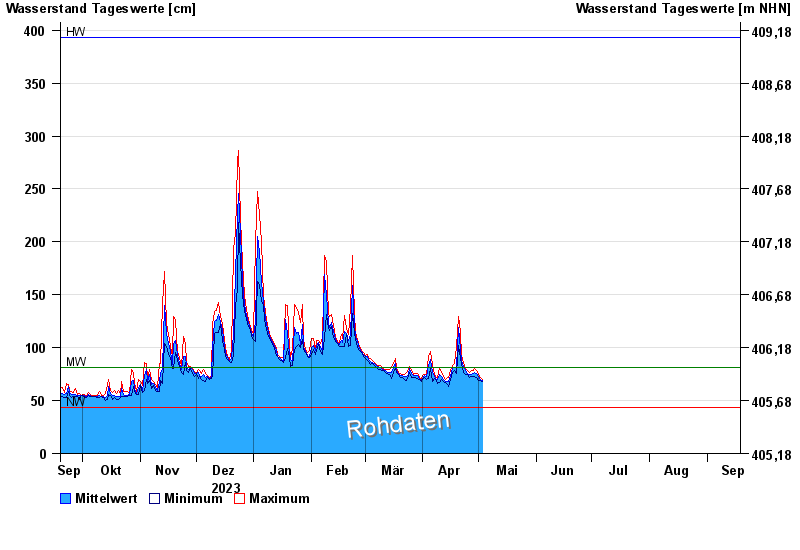
Jahresgrafik Sägmühle / Schwarzer Regen
Wasserstand vom 19.09.2023 bis zum 18.09.2024
| Datum | Mittelwert [cm] | Maximum [cm] | Minimum [cm] |
|---|---|---|---|
| 16.06.2024 | 80 | 80 | 79 |
| 15.06.2024 | 81 | 82 | 80 |
| 14.06.2024 | 84 | 85 | 82 |
| 13.06.2024 | 85 | 89 | 84 |
| 12.06.2024 | 88 | 91 | 85 |
| 11.06.2024 | 98 | 104 | 90 |
| 10.06.2024 | 106 | 122 | 88 |
© Bayerisches Landesamt für Umwelt 2024