
- Startseite >
- Flüsse >
- Wasserstand >
- Untere Donau >
- Sägmühle >
- Jahresgrafik

Jahresgrafik Sägmühle / Schwarzer Regen
Wasserstand vom 19.09.2023 bis zum 18.09.2024
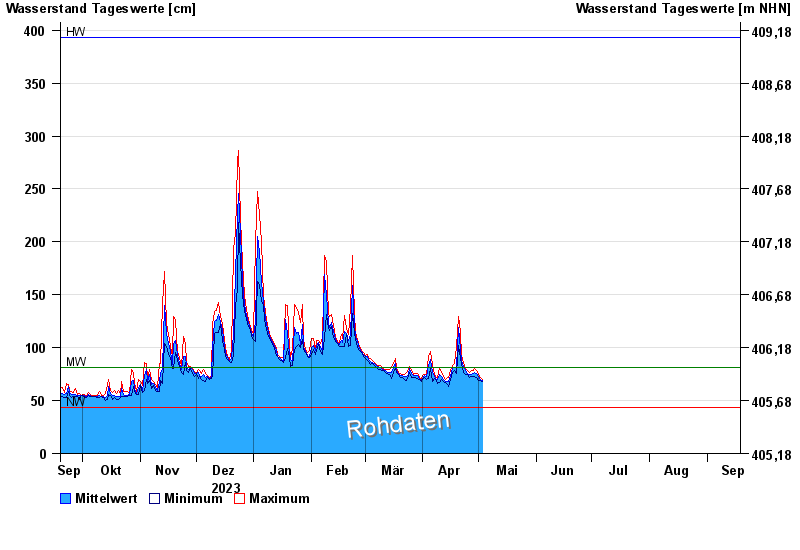
| Datum | Mittelwert [cm] | Maximum [cm] | Minimum [cm] |
|---|---|---|---|
| 24.04.2024 | 78 | 80 | 75 |
| 23.04.2024 | 82 | 86 | 77 |
| 22.04.2024 | 88 | 93 | 84 |
| 21.04.2024 | 98 | 114 | 90 |
| 20.04.2024 | 119 | 129 | 102 |
| 19.04.2024 | 81 | 101 | 76 |
| 18.04.2024 | 81 | 85 | 78 |
© Bayerisches Landesamt für Umwelt 2024