
- Startseite >
- Flüsse >
- Wasserstand >
- Untere Donau >
- Passau Ingling >
- Jahresgrafik

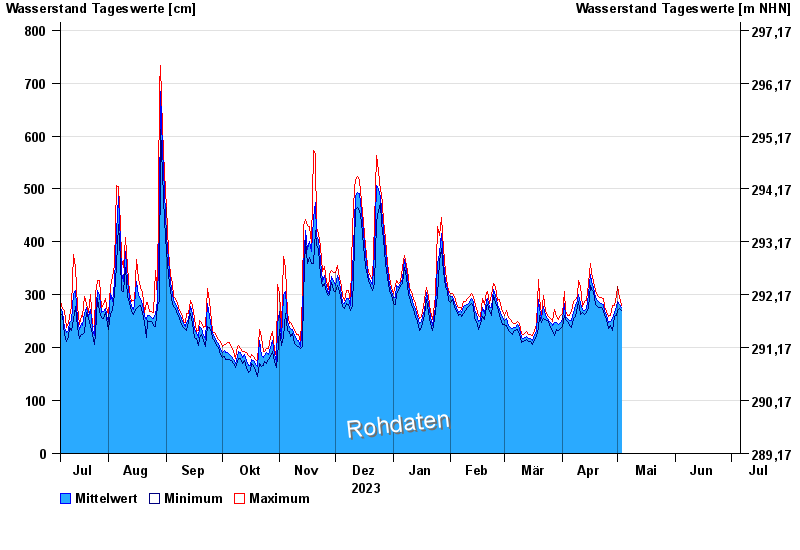
Jahresgrafik Passau Ingling / Inn
Wasserstand vom 06.07.2023 bis zum 05.07.2024
| Datum | Mittelwert [cm] | Maximum [cm] | Minimum [cm] |
|---|---|---|---|
| 27.04.2024 | 243 | 245 | 242 |
| 26.04.2024 | 248 | 259 | 237 |
| 25.04.2024 | 260 | 269 | 253 |
| 24.04.2024 | 269 | 277 | 261 |
| 23.04.2024 | 282 | 292 | 269 |
| 22.04.2024 | 283 | 294 | 275 |
| 21.04.2024 | 286 | 294 | 276 |
© Bayerisches Landesamt für Umwelt 2024