
- Startseite >
- Flüsse >
- Wasserstand >
- Untere Donau >
- Passau Ingling >
- Jahresgrafik

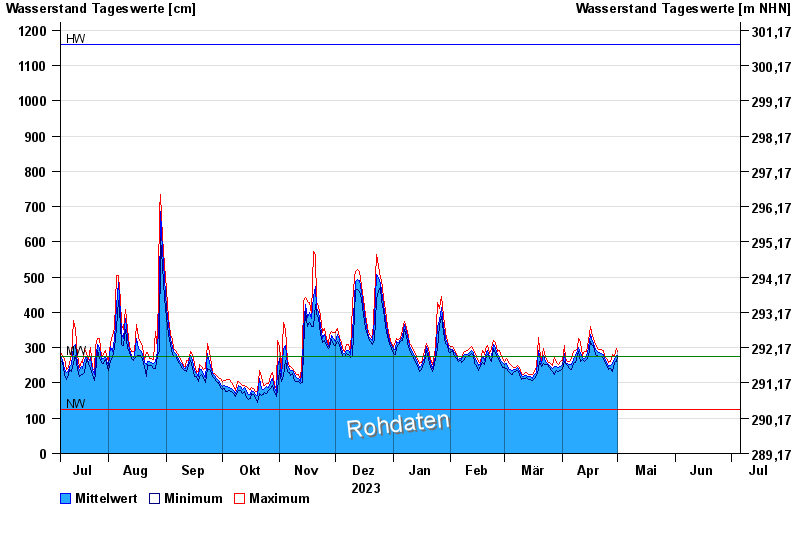
Jahresgrafik Passau Ingling / Inn
Wasserstand vom 06.07.2023 bis zum 05.07.2024
| Datum | Mittelwert [cm] | Maximum [cm] | Minimum [cm] |
|---|---|---|---|
| 18.04.2024 | 317 | 325 | 312 |
| 17.04.2024 | 325 | 343 | 310 |
| 16.04.2024 | 338 | 360 | 317 |
| 15.04.2024 | 301 | 321 | 276 |
| 14.04.2024 | 274 | 289 | 267 |
| 13.04.2024 | 270 | 288 | 262 |
| 12.04.2024 | 272 | 278 | 266 |
© Bayerisches Landesamt für Umwelt 2024