
- Startseite >
- Flüsse >
- Wasserstand >
- Naab - Regen >
- Untereppenried >
- Jahresgrafik

Jahresgrafik Untereppenried / Ascha
Wasserstand vom 01.01.2024 bis zum 04.05.2024
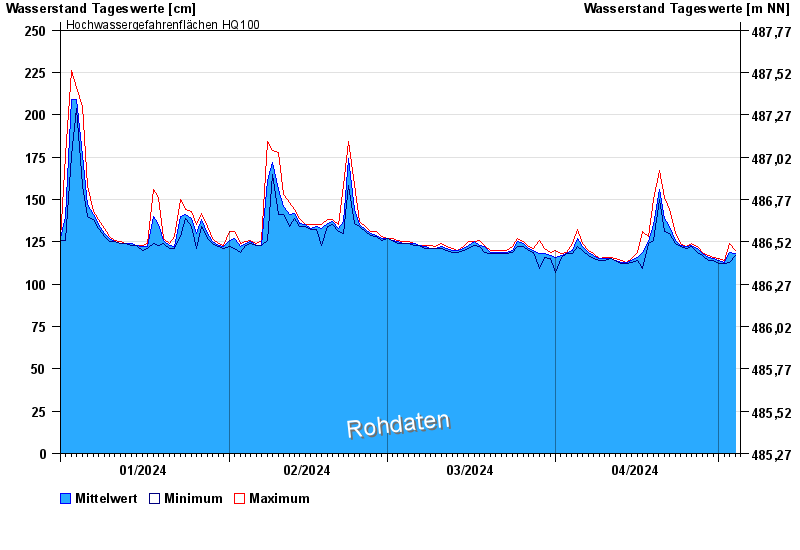
- Hochwassergefahrenfläche HQ100 250 cm
| Datum | Mittelwert [cm] | Maximum [cm] | Minimum [cm] |
|---|---|---|---|
| 04.05.2024 | 119 | 120 | 117 |
| 03.05.2024 | 119 | 124 | 113 |
| 02.05.2024 | 113 | 114 | 112 |
| 01.05.2024 | 114 | 115 | 112 |
| 30.04.2024 | 115 | 116 | 114 |
| 29.04.2024 | 116 | 117 | 114 |
| 28.04.2024 | 118 | 119 | 117 |
© Bayerisches Landesamt für Umwelt 2024