
- Startseite >
- Flüsse >
- Wasserstand >
- Naab - Regen >
- Untereppenried >
- Jahresgrafik

Jahresgrafik Untereppenried / Ascha
Wasserstand vom 01.01.2024 bis zum 25.04.2024
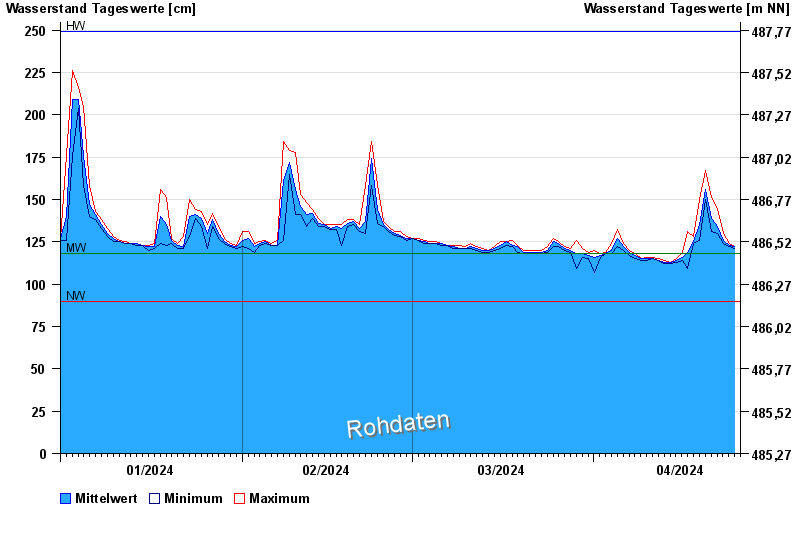
| Datum | Mittelwert [cm] | Maximum [cm] | Minimum [cm] |
|---|---|---|---|
| 25.04.2024 | 121 | 122 | 121 |
| 24.04.2024 | 123 | 124 | 122 |
| 23.04.2024 | 126 | 130 | 124 |
| 22.04.2024 | 134 | 144 | 130 |
| 21.04.2024 | 139 | 151 | 131 |
| 20.04.2024 | 156 | 167 | 150 |
| 19.04.2024 | 135 | 150 | 126 |
© Bayerisches Landesamt für Umwelt 2024