
- Startseite >
- Flüsse >
- Wasserstand >
- Naab - Regen >
- Pulling >
- Jahresgrafik

Jahresgrafik Pulling / Regen
Wasserstand vom 22.09.2021 bis zum 21.09.2022
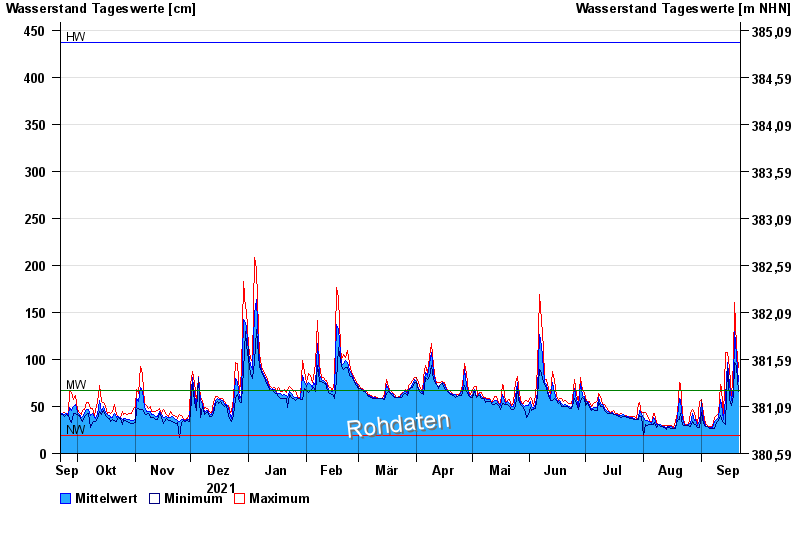
| Datum | Mittelwert [cm] | Maximum [cm] | Minimum [cm] |
|---|---|---|---|
| 21.09.2022 | 77 | 91 | 66 |
| 20.09.2022 | 104 | 115 | 92 |
| 19.09.2022 | 130 | 161 | 97 |
| 18.09.2022 | 71 | 97 | 62 |
| 17.09.2022 | 56 | 61 | 51 |
| 16.09.2022 | 73 | 91 | 57 |
| 15.09.2022 | 97 | 107 | 91 |
© Bayerisches Landesamt für Umwelt 2024