
- Startseite >
- Flüsse >
- Wasserstand >
- Naab - Regen >
- Pulling >
- Jahresgrafik

Jahresgrafik Pulling / Regen
Wasserstand vom 22.09.2020 bis zum 21.09.2021
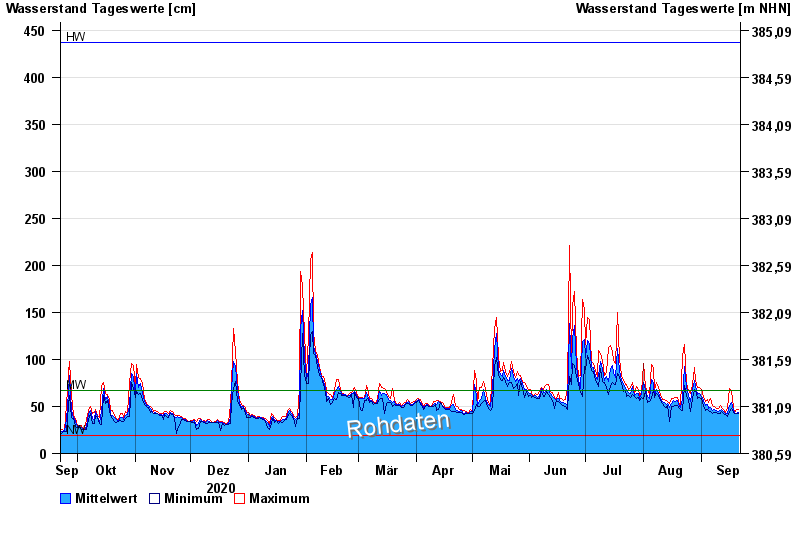
| Datum | Mittelwert [cm] | Maximum [cm] | Minimum [cm] |
|---|---|---|---|
| 21.09.2021 | 44 | 47 | 43 |
| 20.09.2021 | 43 | 47 | 42 |
| 19.09.2021 | 44 | 44 | 42 |
| 18.09.2021 | 46 | 49 | 44 |
| 17.09.2021 | 54 | 67 | 48 |
| 16.09.2021 | 51 | 69 | 45 |
| 15.09.2021 | 43 | 49 | 39 |
© Bayerisches Landesamt für Umwelt 2024