
- Startseite >
- Flüsse >
- Wasserstand >
- Naab - Regen >
- Pulling >
- Jahresgrafik

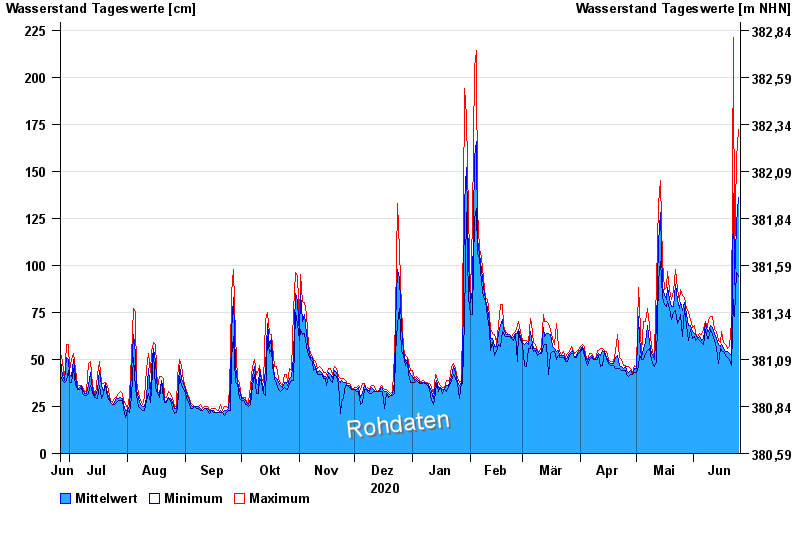
Jahresgrafik Pulling / Regen
Wasserstand vom 26.06.2020 bis zum 25.06.2021
| Datum | Mittelwert [cm] | Maximum [cm] | Minimum [cm] |
|---|---|---|---|
| 25.06.2021 | 136 | 172 | 94 |
| 24.06.2021 | 122 | 157 | 96 |
| 23.06.2021 | 90 | 102 | 73 |
| 22.06.2021 | 138 | 221 | 82 |
| 21.06.2021 | 52 | 70 | 47 |
| 20.06.2021 | 53 | 57 | 50 |
| 19.06.2021 | 54 | 56 | 51 |
© Bayerisches Landesamt für Umwelt 2024