
- Startseite >
- Flüsse >
- Wasserstand >
- Naab - Regen >
- Pulling >
- Jahresgrafik

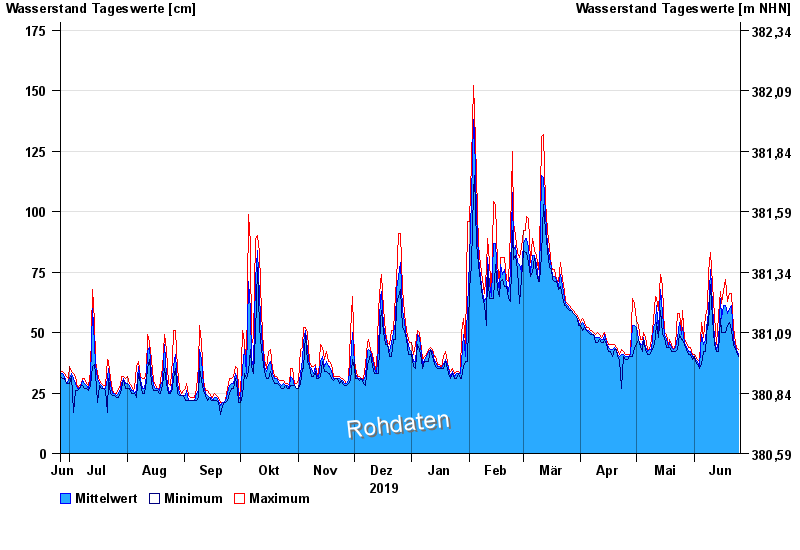
Jahresgrafik Pulling / Regen
Wasserstand vom 26.06.2019 bis zum 25.06.2020
| Datum | Mittelwert [cm] | Maximum [cm] | Minimum [cm] |
|---|---|---|---|
| 25.06.2020 | 41 | 43 | 40 |
| 24.06.2020 | 43 | 44 | 42 |
| 23.06.2020 | 44 | 46 | 43 |
| 22.06.2020 | 47 | 52 | 45 |
| 21.06.2020 | 61 | 66 | 51 |
| 20.06.2020 | 60 | 66 | 54 |
| 19.06.2020 | 58 | 63 | 53 |
© Bayerisches Landesamt für Umwelt 2024